A step-by-step guide to building live, push-based dashboards in Oracle APEX with a complete working example using Oracle Advanced Queuing and WebSockets.
What are WebSockets and why APEX needs them
Traditional APEX dashboards rely on page refreshes or Ajax polling, where the browser repeatedly asks the server, “Is there anything new?” This wastes bandwidth, increases latency, and makes the system feel sluggish.
WebSockets completely transform this model. Once the HTTP handshake is complete, a persistent, full-duplex channel opens between the browser and the server. The server can now send data immediately as changes occur, eliminating the need for repeated polling.
❌ Old way polling
The browser calls apex.server.process() every 5 seconds. Most calls do not yield a response. High server load and stale data.
✅ New way WebSocket push
The server transmits data as soon as it changes. No call goes to waste. True real-time latency of less than 100ms.
Architecture overview
Here is how the full stack works for the real-time APEX dashboard:
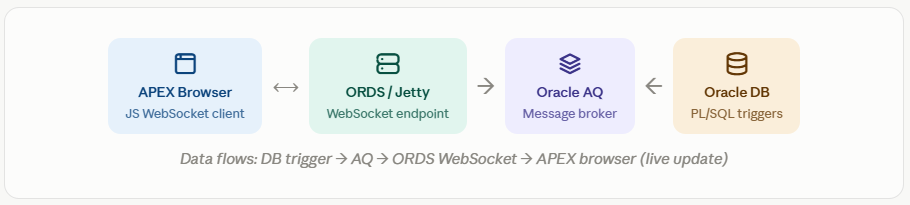
Oracle AQ (Advanced Queuing) acts as the message broker. When data changes in the DB, a PL/SQL trigger enqueues a message. ORDS listens to the queue and forwards it to all connected WebSocket clients instantly.
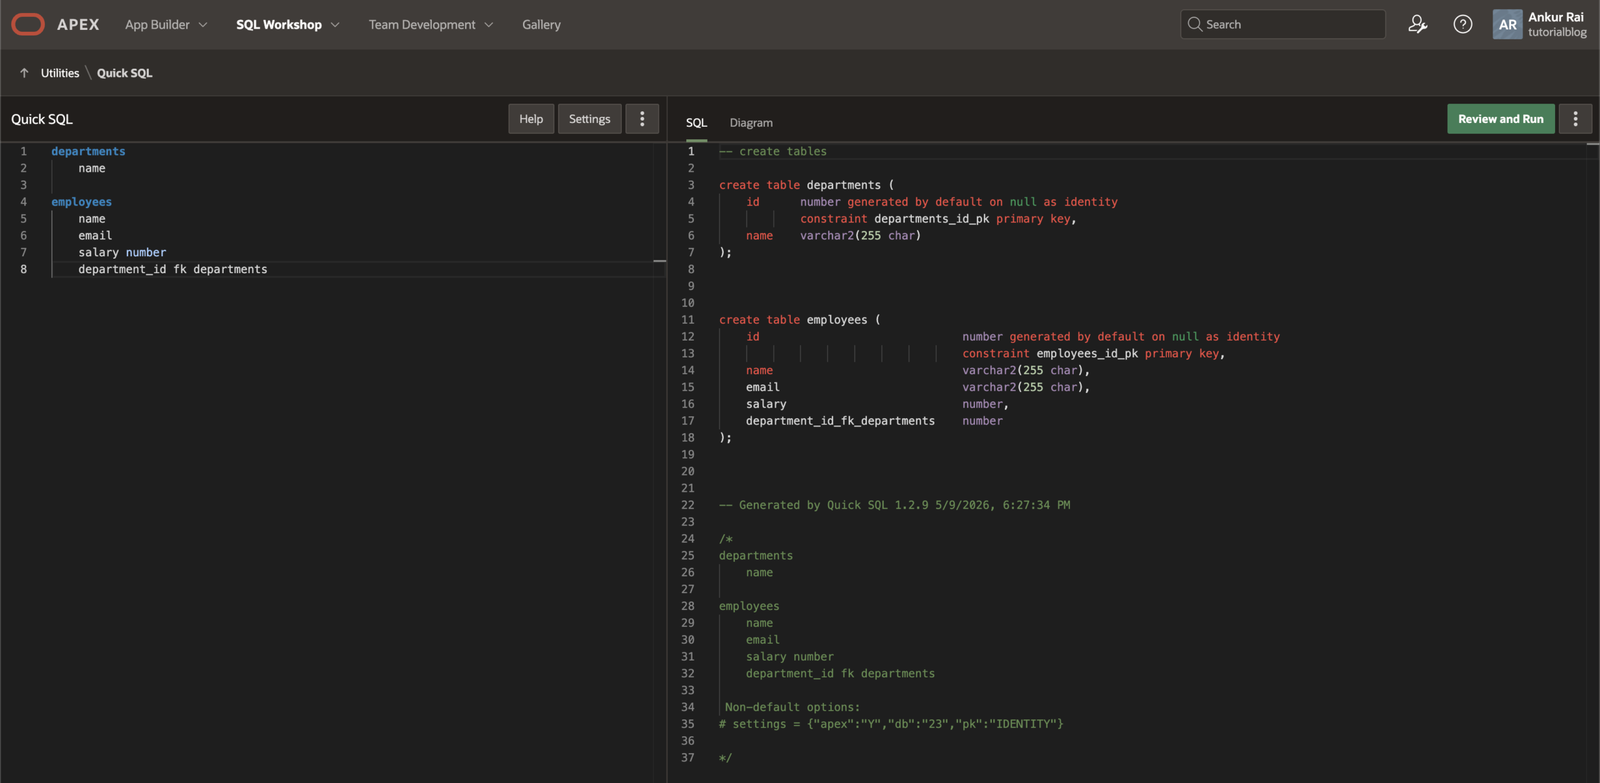
Step 1: Set up Oracle Advanced Queuing
First, create a queue table and a queue in the database. Connect as the DBA or APEX schema user:
DBMS_AQADM.CREATE_QUEUE_TABLE(
  queue_table        => 'APEX_DASHBOARD_QT',
  queue_payload_type => 'SYS.AQ$_JMS_TEXT_MESSAGE'
);

-- 2. Create the queue
DBMS_AQADM.CREATE_QUEUE(
  queue_name  => 'APEX_DASHBOARD_Q',
  queue_table => 'APEX_DASHBOARD_QT'
);

-- 3. Start the queue
DBMS_AQADM.START_QUEUE(
  queue_name => 'APEX_DASHBOARD_Q'
);
Create a trigger to enqueue when data changes.
This trigger executes when a row is inserted or updated in your source table (e.g., SALES_DATA) and sends the new values to the queue in JSON format:
CREATE OR REPLACE TRIGGER trg_sales_realtime
AFTER INSERT OR UPDATE ON sales_data
FOR EACH ROW
DECLARE
  l_msg    SYS.AQ$_JMS_TEXT_MESSAGE;
  l_enq_opts  DBMS_AQ.ENQUEUE_OPTIONS_T;
  l_msg_props DBMS_AQ.MESSAGE_PROPERTIES_T;
  l_msg_id    RAW(16);
  l_payload   VARCHAR2(4000);
BEGIN
  -- Build JSON payload
  l_payload := '{'
    || '"region":"'  || :NEW.region      || '",'
    || '"amount":'   || :NEW.sale_amount || ','
    || '"units":'    || :NEW.units_sold  || ','
    || '"ts":"'      || TO_CHAR(SYSDATE,'HH24:MI:SS') || '"'
    || '}';

  l_msg := SYS.AQ$_JMS_TEXT_MESSAGE.construct();
  l_msg.set_text(l_payload);

  DBMS_AQ.ENQUEUE(
    queue_name         => 'APEX_DASHBOARD_Q',
    enqueue_options    => l_enq_opts,
    message_properties => l_msg_props,
    payload            => l_msg,
    msgid              => l_msg_id
  );
END;
Grant EXECUTE ON DBMS_AQ and DBMS_AQADM to your APEX schema user. Without these, the trigger will silently fail.
Step 2: Configure the ORDS WebSocket endpoint
ORDS 22.2+ includes native WebSocket support. Create a WebSocket handler that subscribes to an AQ queue and broadcasts to clients.
BEGIN
  ORDS.define_module(
    p_module_name    => 'dashboard_ws',
    p_base_path      => '/dashboard/',
    p_items_per_page => 0
  );

  ORDS.define_handler(
    p_module_name    => 'dashboard_ws',
    p_pattern        => 'live',
    p_method         => 'WS',         -- WebSocket method
    p_source_type    => ORDS.source_type_plsql,
    p_source         =>
      'BEGIN
         apex_web_socket.send_message(
           p_queue_name => ''APEX_DASHBOARD_Q'',
           p_session_id => :session_id
         );
       END;'
  );

  COMMIT;
END;
The WebSocket URL will be: wss://your-ords-host/ords/schema/dashboard/live. Replace ‘schema’ with the name of your actual APEX schema.
Step 3: Build the APEX dashboard page
In APEX App Builder, create a new blank page. Add the regions listed below:
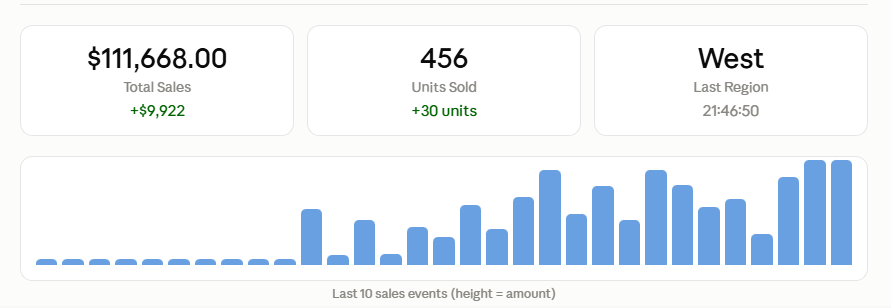
Add Static Content Area Metric Card
Create a static content region with the ID dashboard-metrics. This will contain our HTML metric cards that update in real-time. Set the region template to “Blank with Attributes”.
<!-- Real-Time Metric Cards -->
<div class="t-Cards t-Cards--3Cols">

  <div class="t-Card" id="card-total-sales">
    <div class="t-Card-wrap">
      <div class="t-Card-titleWrap">
        <h3 class="t-Card-title">Total Sales</h3>
      </div>
      <div class="t-Card-body">
        <span id="val-total-sales" class="t-Card-subTitle">
          $0</span>
      </div>
    </div>
  </div>

  <div class="t-Card" id="card-units">
    <div class="t-Card-wrap">
      <div class="t-Card-titleWrap">
        <h3 class="t-Card-title">Units Sold</h3>
      </div>
      <div class="t-Card-body">
        <span id="val-units" class="t-Card-subTitle">0</span>
      </div>
    </div>
  </div>

  <div class="t-Card" id="card-region">
    <div class="t-Card-wrap">
      <div class="t-Card-titleWrap">
        <h3 class="t-Card-title">Last Region</h3>
      </div>
      <div class="t-Card-body">
        <span id="val-region" class="t-Card-subTitle">—</span>
      </div>
    </div>
  </div>

</div>
Add a JavaScript Dynamic Action On Page Load
Create a Dynamic Action: Event = “Page Load”, Action = “Execute JavaScript Code”. Paste the WebSocket client code below.
(function() {

  const WS_URL = 'wss://' + location.host +
                 '/ords/' + apex.env.APP_SCHEMA +
                 '/dashboard/live';

  let socket, totalSales = 0, totalUnits = 0;

  function connect() {
    socket = new WebSocket(WS_URL);

    socket.onopen = function() {
      console.log('WebSocket connected ✓');
      updateStatus('connected');
    };

    socket.onmessage = function(event) {
      const data = JSON.parse(event.data);
      updateDashboard(data);
      appendLog(data);
    };

    socket.onclose = function() {
      updateStatus('reconnecting');
      // Auto-reconnect after 3 seconds
      setTimeout(connect, 3000);
    };

    socket.onerror = function(err) {
      console.error('WebSocket error:', err);
    };
  }

  function updateDashboard(data) {
    // Accumulate totals
    totalSales  += parseFloat(data.amount  || 0);
    totalUnits  += parseInt(data.units    || 0);

    // Update metric cards
    $('#val-total-sales').text(
      '$' + totalSales.toLocaleString('en-US',
        { minimumFractionDigits: 2 })
    );
    $('#val-units').text(totalUnits.toLocaleString());
    $('#val-region').text(data.region);

    // Flash animation on update
    $('.t-Card').addClass('u-highlight');
    setTimeout(function() {
      $('.t-Card').removeClass('u-highlight');
    }, 600);

    // Refresh APEX chart region (if you have one)
    apex.region('sales-chart')?.refresh();
  }

  function updateStatus(state) {
    const el = $('#ws-status');
    if (state === 'connected') {
      el.text('● Live').css('color', '#22c55e');
    } else {
      el.text('○ Reconnecting...').css('color', '#f59e0b');
    }
  }

  function appendLog(data) {
    const log = $('#ws-log');
    const line = `[${data.ts}] ${data.region}: $${data.amount}`;
    log.prepend('<div>' + line + '</div>');
    // Keep last 50 messages
    log.find('div:gt(49)').remove();
  }

  // Kick off connection
  connect();

})();
Step 4: Test it end to end
Once everything is connected, run this PL/SQL in the SQL Workshop to simulate the flow of live data in your dashboard:
BEGIN
  FOR i IN 1..10 LOOP
    INSERT INTO sales_data (
      region,
      sale_amount,
      units_sold,
      created_at
    ) VALUES (
      CASE MOD(i, 4)
        WHEN 0 THEN 'North'
        WHEN 1 THEN 'South'
        WHEN 2 THEN 'East'
        ELSE         'West'
      END,
      ROUND(DBMS_RANDOM.VALUE(100, 9999), 2),
      ROUND(DBMS_RANDOM.VALUE(1, 50)),
      SYSDATE
    );
    DBMS_LOCK.SLEEP(1); -- 1 second between events
  END LOOP;
  COMMIT;
END;
Keep an eye on your APEX dashboard every INSERT triggers a PL/SQL block that enqueues a message, and the WebSocket pushes updates to every open browser in less than 100ms.
Best practices and tips
- Always implement auto-reconnect: Network interruptions can occur. The JavaScript example above automatically reconnects after 3 seconds. For production, consider using ‘exponential backoff’: start at 1 second, double the time with each attempt, and cap it at a maximum of 30 seconds.
- Use JSON for all payloads: Keep AQ message payloads as compact JSON. Parse them in JavaScript using
JSON.parse(event.data). Do not use XML, as it is larger and takes longer to parse in the browser. - Throttle UI updates for high-frequency data: If your queue generates more than 100 messages per second, batch DOM updates using
requestAnimationFrameor a debounce function. Updating the DOM 100 times a second can cause jank or stuttering. - Secure with APEX session authentication: Pass the APEX session ID as a query parameter in the WebSocket URL and validate it within your ORDS handler. Never expose an unauthenticated WebSocket endpoint.
Production tip: Use Oracle GoldenGate or CDC (Change Data Capture) instead of row triggers if you’re handling millions of rows per day. Triggers at that scale add overhead to every DML statement.
Conclusion
You now have a complete real-time dashboard pipeline: Oracle Triggers → AQ → ORDS WebSocket → APEX Browser. The key advantage is that WebSockets completely eliminate the need for polling; your dashboard responds instantly as data changes, with a latency of less than 100ms.
This approach works for any event-driven scenario such as live inventory, IoT sensor feeds, financial tickers, or support queue monitoring. Simply adjust the table and JSON structure, and you are all set.
Hi, I’m Ankur Rai, an Oracle APEX Developer with 6+ years of professional experience in building enterprise applications. I specialize in creating scalable and efficient solutions using Oracle APEX, PL/SQL, and SQL to solve real-world business challenges.
I am a 3X Oracle APEX Professional Certified Developer and also an Oracle ACE Associate Member, actively contributing to the Oracle community by sharing knowledge, insights, and best practices. Through my blogs, I aim to help developers learn, grow, and build better Oracle APEX applications together.