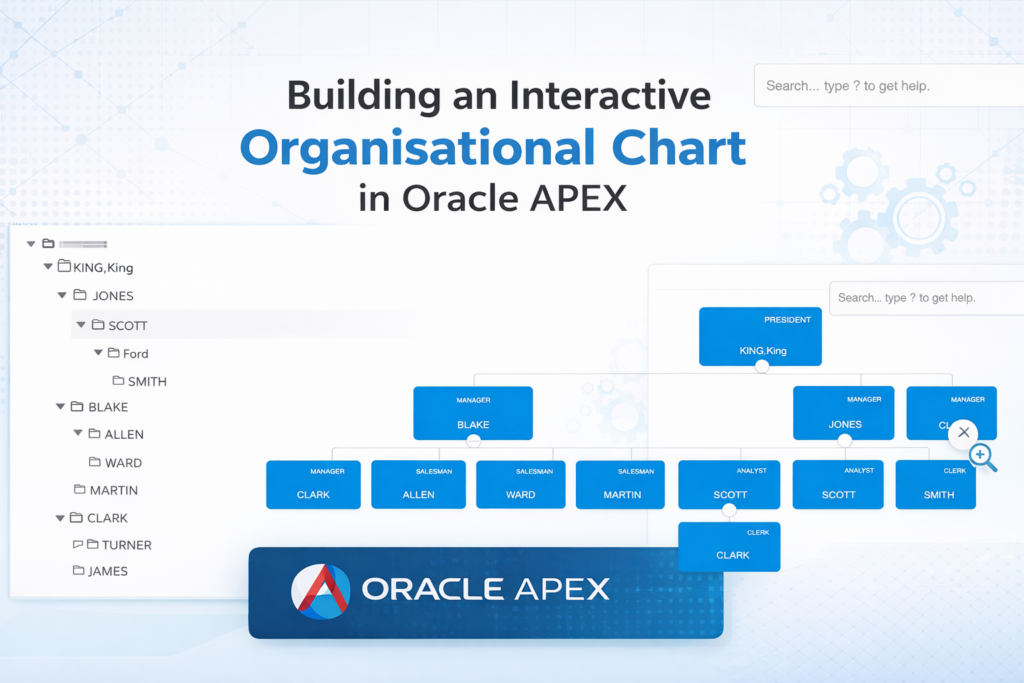
Visualizing hierarchy is one of the most common requirements in enterprise applications—especially for employee structures. In Oracle APEX, you can build an organisational chart in multiple ways depending on your UI needs.
In this blog, we’ll explore two practical approaches:
- ✅ Tree Region (Quick & Native)
- 🚀 Interactive Org Chart using JavaScript (Collapsible + Zoom + Modern UI)
🔹 Approach 1: Using Tree Region (Native APEX)
Oracle APEX provides a Tree Region to display hierarchical data using SQL.
SELECT
    empno,
    ename AS employee_name,
    job AS title,
    mgr AS manager_id
FROM emp;
⚙️ Configuration
- Node Label Column → EMPLOYEE_NAME
- Node Value Column → EMPNO
- Hierarchy → Computed with SQL
- Node ID Column → EMPNO
- Parent Key Column → MANAGER_ID
- Start Tree With → Value is NULL
✅ Output
- Displays hierarchy in expandable tree format
- Simple and fast to implement
- Uses built-in APEX features
❌ Limitations
- Not visually appealing (no card layout)
- No zoom or drag
- Not suitable for modern dashboards
🚀 Approach 2: Interactive Org Chart (Collapsible + Zoom)
To achieve a modern, visually rich organisational chart, we use JavaScript + AJAX + JSON.
🔹 Step 1: Add HTML Region
<div id="orgChart"></div>🔹 Step 2: Include JS Library
Add in Page → JavaScript → File URLs
https://balkan.app/js/OrgChart.js🔹 Step 3: Create AJAX Callback
DECLARE
    l_json CLOB;
BEGIN
    SELECT JSON_ARRAYAGG(
        JSON_OBJECT(
            'id' VALUE empno,
            'name' VALUE employee_name,
            'title' VALUE title,
            'pid' VALUE manager_id,
            'tags' VALUE JSON_ARRAY(department)
        )
    )
    INTO l_json
    FROM (
        SELECT
            e.empno,
            e.ename AS employee_name,
            e.job   AS title,
            e.mgr   AS manager_id,
            d.dname AS department
        FROM emp e
        JOIN dept d ON e.deptno = d.deptno
    );

    HTP.P(l_json);
END;
🔹 Step 4: JavaScript (Execute on Page Load)
apex.server.process("GET_ORG_DATA", {}, {
    success: function(data) {

        var chart = new OrgChart(document.getElementById("orgChart"), {

            nodes: data,

            nodeBinding: {
                field_0: "name",
                field_1: "title"
            },

            template: "ana",

            collapse: {
                level: 1
            },

            enableSearch: true,

            mouseScrool: OrgChart.action.zoom,

            zoom: {
                speed: 120,
                smooth: true
            },

            enableDragDrop: true

        });

    }
});
🎯 Key Features Achieved
✔ Collapsible hierarchy
✔ Zoom in / Zoom out
✔ Drag to navigate
✔ Search employees
✔ Clean card-based UI
✔ Department-based customization (via tags)
🔥 Tree Region vs Org Chart
| Feature | Tree Region | JS Org Chart |
|---|---|---|
| Setup Time | ✅ Fast | ⚠️ Medium |
| UI | ❌ Basic | ✅ Modern |
| Collapsible | ✅ Yes | ✅ Yes |
| Zoom | ❌ No | ✅ Yes |
| Drag | ❌ No | ✅ Yes |
| Custom Styling | ❌ Limited | ✅ Full Control |
💡 When to Use What?
👉 Use Tree Region when:
- You need quick implementation
- UI is not a priority
👉 Use Interactive Org Chart when:
- You want modern dashboards
- UX matters
- You need zoom, drag, styling
🚀 Final Thoughts
While Oracle APEX provides powerful native components like Tree Region, integrating JavaScript libraries like OrgChart.js unlocks a whole new level of UI experience.
For enterprise-grade applications, the second approach is highly recommended as it delivers:
✨ Better visualization
✨ Improved user interaction
✨ Scalable design
📌 What’s Next?
You can further enhance this solution by:
- Adding employee profile images 👤
- Color-coding departments 🎨
- Click → Navigate to employee detail page 🔗
- Export org chart as PDF 📄
If you found this helpful, feel free to connect and share your thoughts! 🚀
Hi, I’m Ankur Rai, an Oracle APEX Developer with 6+ years of professional experience in building enterprise applications. I specialize in creating scalable and efficient solutions using Oracle APEX, PL/SQL, and SQL to solve real-world business challenges.
I am a 3X Oracle APEX Professional Certified Developer and also an Oracle ACE Associate Member, actively contributing to the Oracle community by sharing knowledge, insights, and best practices. Through my blogs, I aim to help developers learn, grow, and build better Oracle APEX applications together.